The Infrastructure
Behind Every Analysis
I combine technology, big data capability, and geospatial domain knowledge to build data foundations that make every downstream analysis defensible. Reliable strategy starts with operational data systems. These pipelines make messy building, commercial place, network, movement, and boundary records traceable and accountable enough for executive decisions and field execution.
Buildings
0Cities Processed
National Building Database
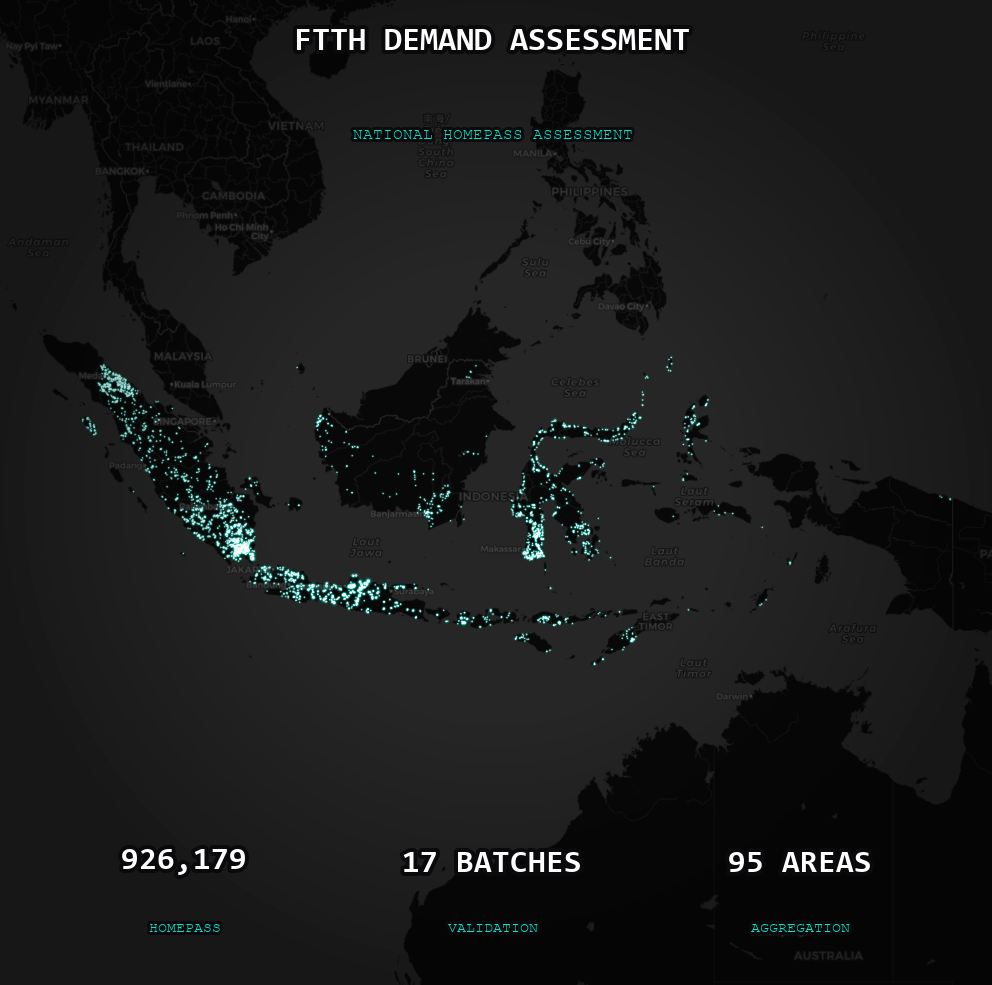
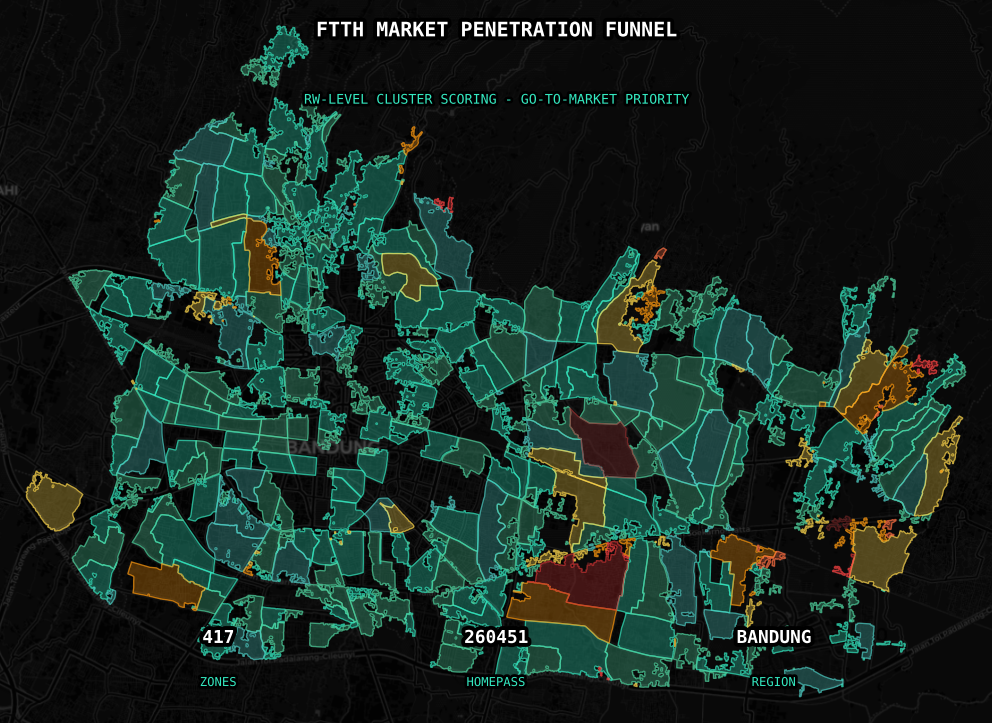
Insight: supporting decision for precise demand assessment, for go to market decision, especially for FTTH and FWA households potential analysis and design process. Methodology: Eliminates manual data collection across 500+ city scale surveys by harmonizing multiple building footprint sources into a unified, deployment ready national database, enhanced with proprietary satellite imagery based building extraction.
Multi feed QA4 InputsDeployment readySatellite Imagery
Scraping
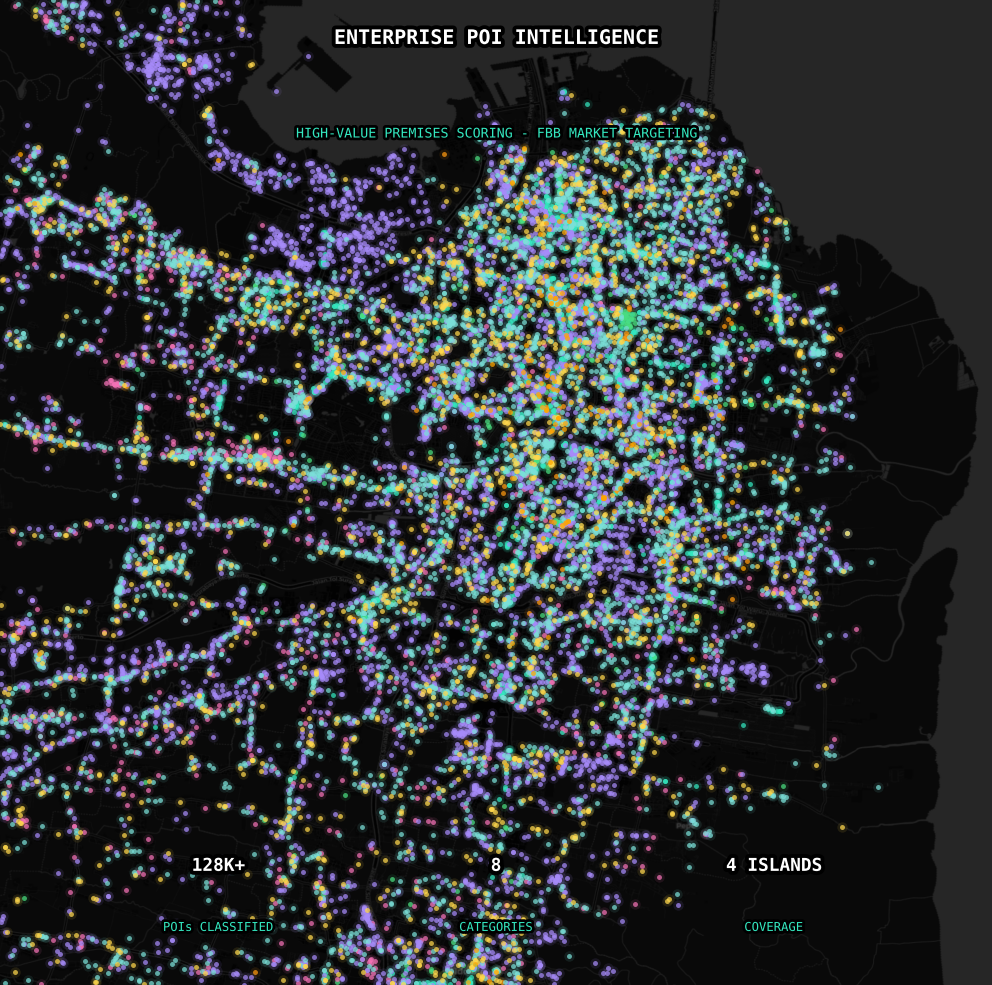
0Point of Interests
Indonesia POI Production Engine
Insight: Reusable commercial density intelligence for market screening, site prioritization, and category based demand views. Methodology: Processes 4M+ commercial place records through schema validation, coordinate QA, brand and category mapping, admin area fill, deduplication, text normalization, and production reporting.
Schema QARecord LinkageDeduplication
Tower Data
Cell Tower Intelligence Grid
Insight: Provider level tower intelligence for coverage context, network opportunity screening, and planning handoff. Methodology: Iterates provider and network sources, extracts tower candidates, generates adaptive grids using land cover and admin context, and runs duplicate tower QA before structured handoff files.
TelecomAdaptive GridHandoffQA
Industrial Data
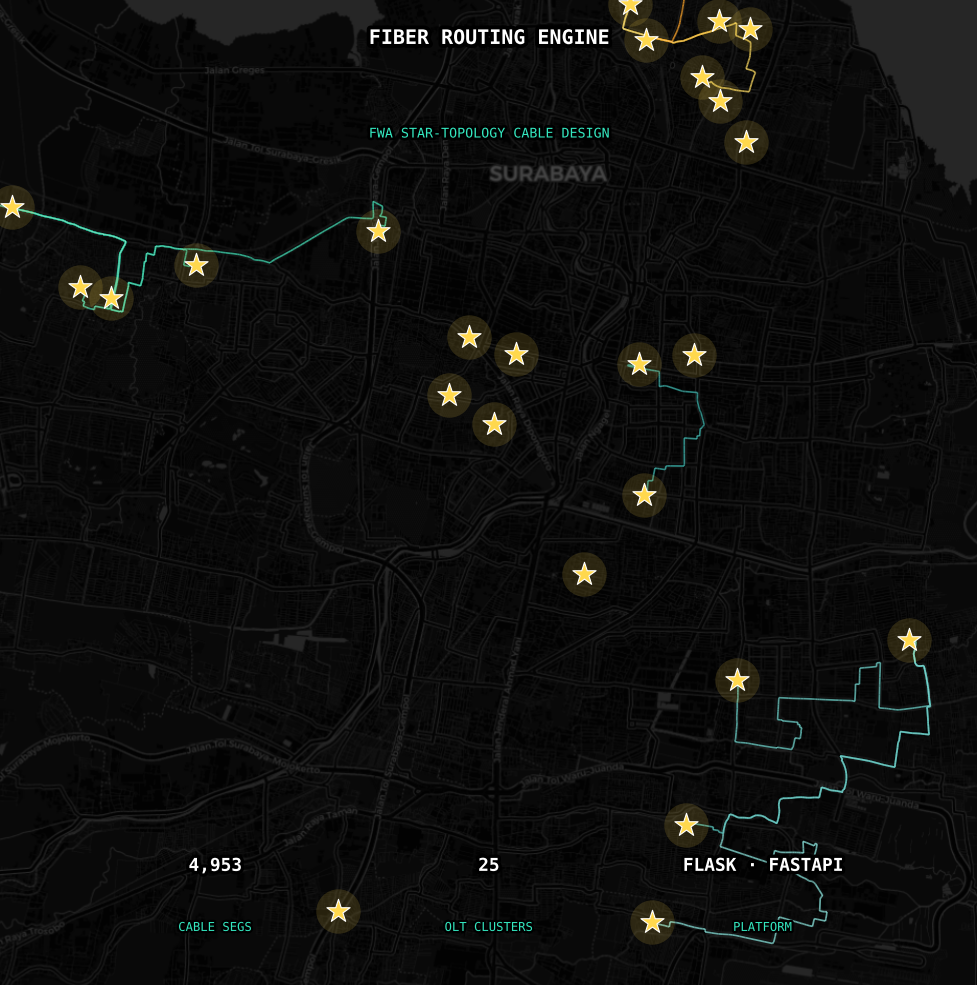
Industrial Corridor POI and Connectivity Intelligence
Insight: B2B telecom planning signal for industrial demand, connectivity coverage, and nearby infrastructure context. Methodology: Fuses industrial and company place records with building and grid context, admin and road joins, provider mix, and coverage comparison for corridor screening.
Industrial RecordsProvider MixSpatial JoinB2B
Analytics
0Grid Resolution
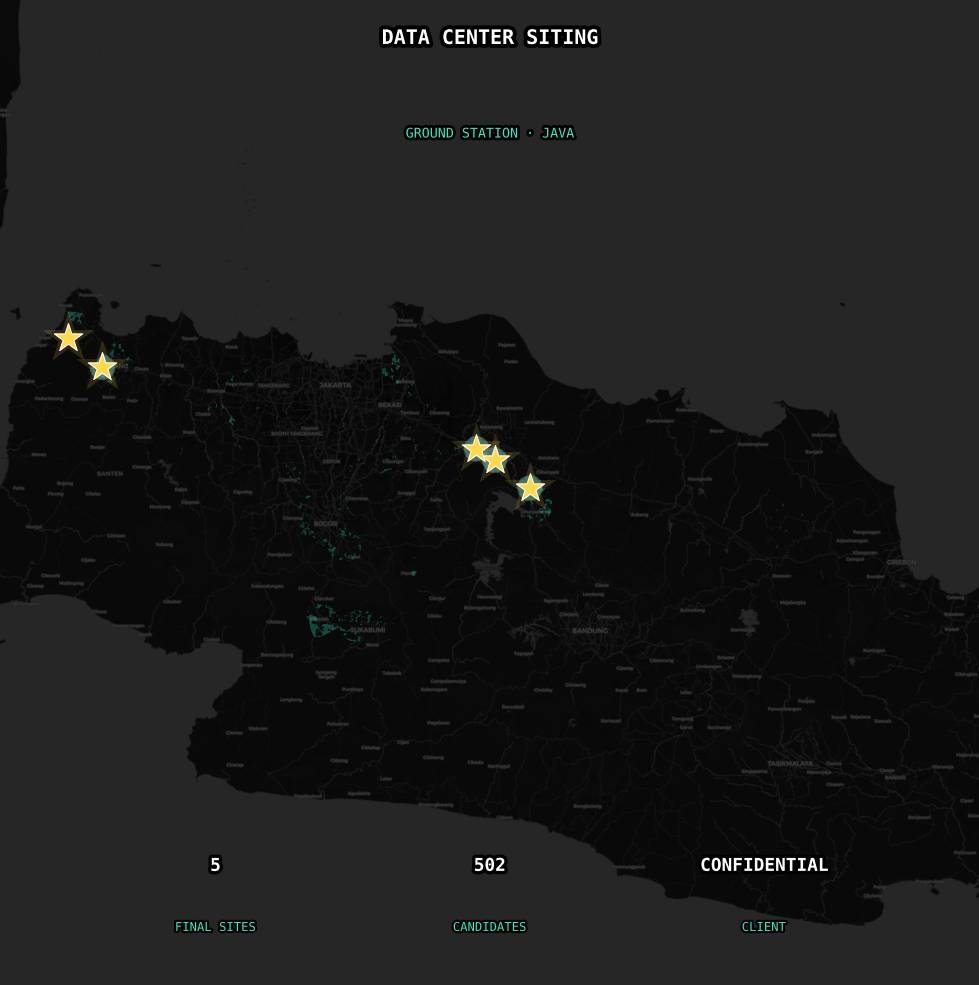
Buying Index Grid
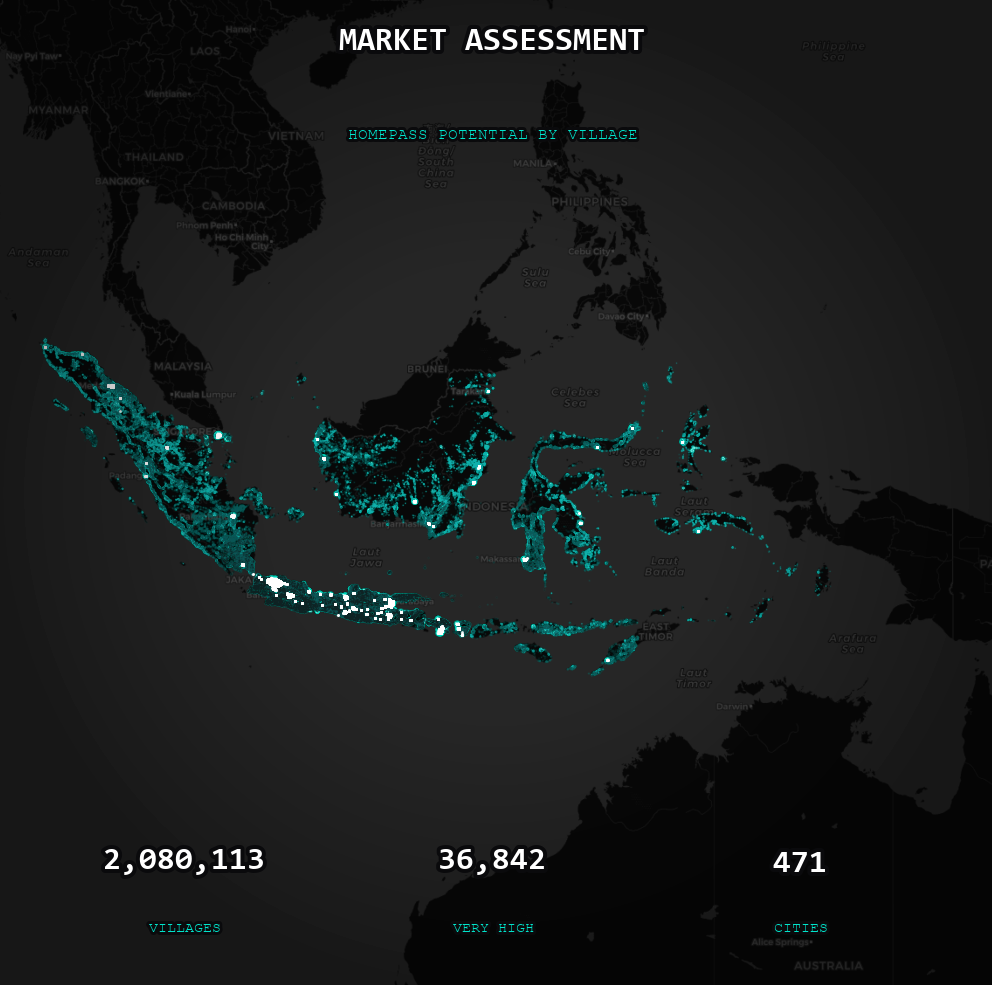
Insight: Single investment grade demand score at 200m resolution for market prioritization and investment sequencing. Methodology: Combines purchasing power, building density, network quality, job ratios, and admin context into one reproducible composite heatmap.
Grid ScoreComposite ScoreInvestment Lens
Network Quality
0Mobile + Fixed
Network Quality Grid
Insight: Pinpoints where incumbent weakness creates lower acquisition cost market entry opportunity. Methodology: Combines mobile and fixed network quality signals, normalizes them to grid level, and flags demand areas where quality gaps support entry timing.
Mobile QualityFixed QoEWeakness Signal
Admin Data
0Admin Hierarchy
Admin Boundary Registration
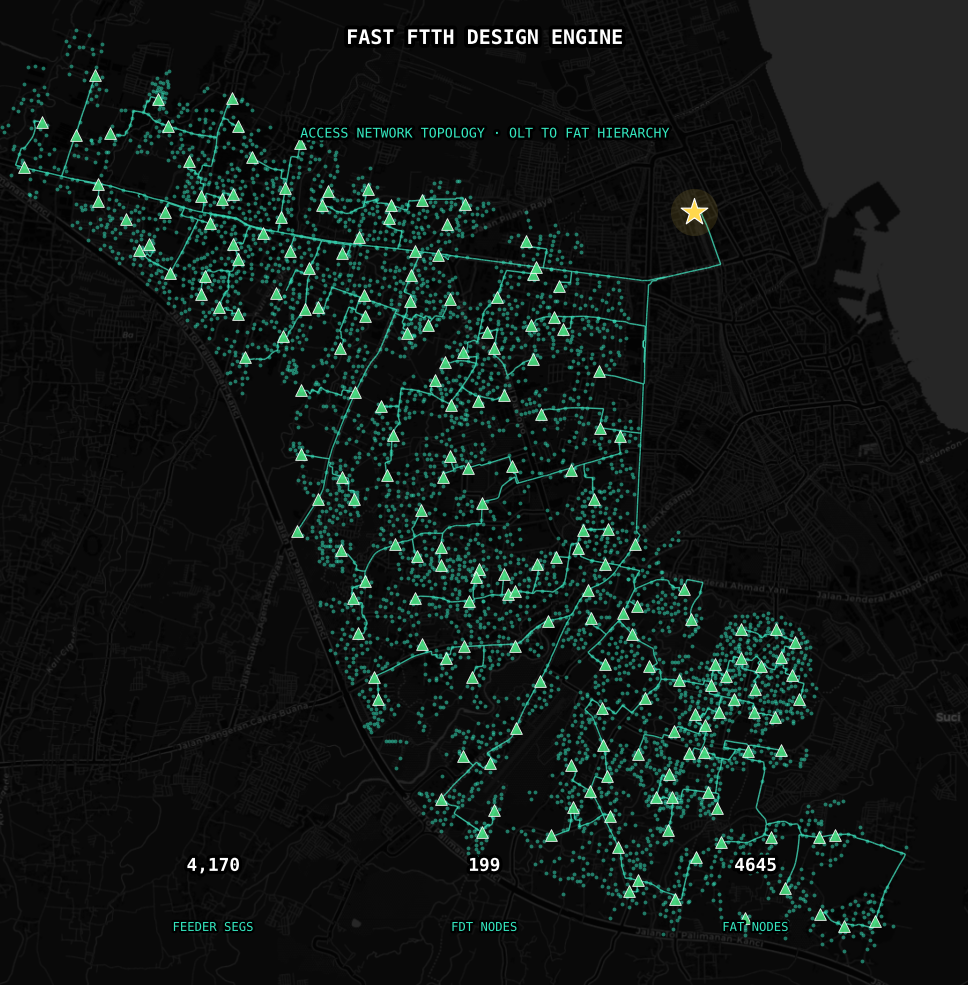
Insight: Enables city level sales reporting and deployment accountability down to village level. Methodology: Links buildings, roads, and POI records to Indonesia's four level admin hierarchy, then packages OLT funnel attribution and field performance tracking across 30+ city batches.
Admin JoinSpatial MatchBatch QA
Network
0ASNs Mapped
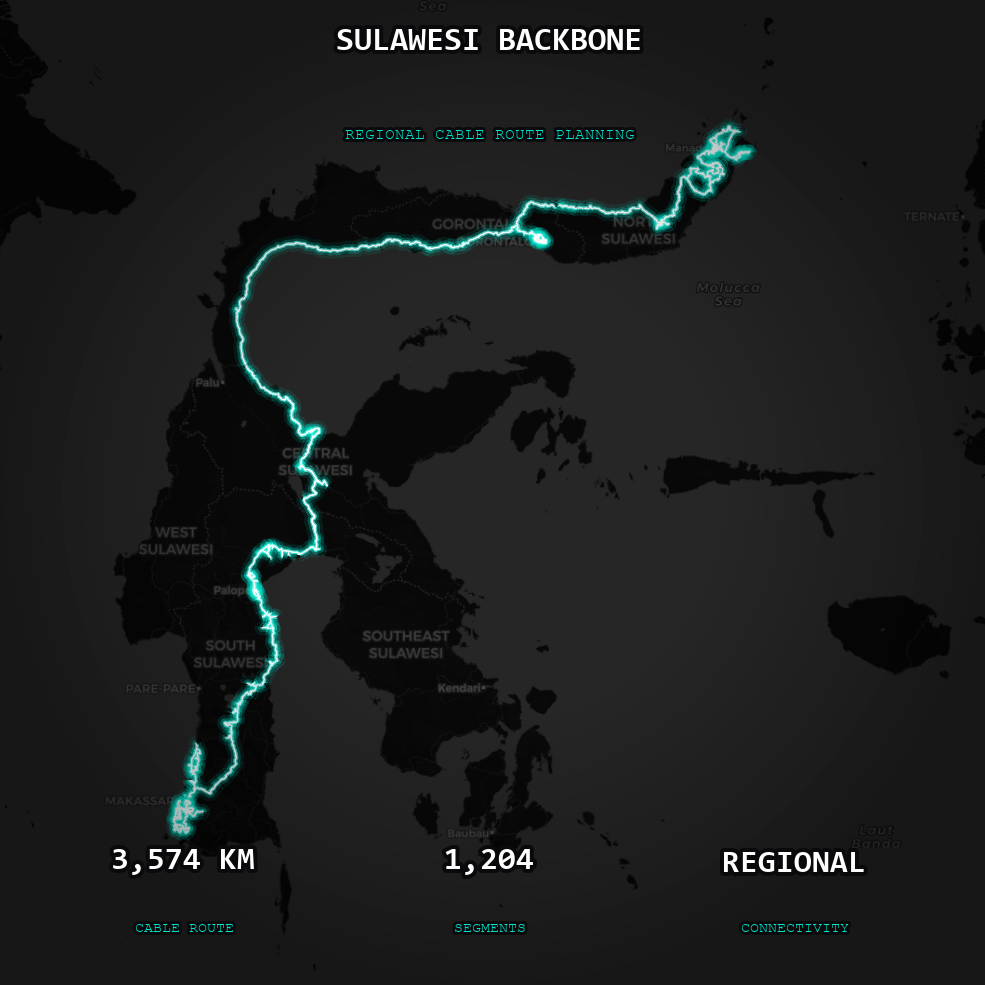
Network Dependency Graph
Insight: Maps Indonesian provider upstream dependencies and peering relationships for backhaul negotiation, market entry risk, and acquisition screening. Methodology: Normalizes ASN records, provider aliases, relationship direction, and peer context into a graph that can be queried by provider, geography, and dependency depth.
Dependency GraphPeering ContextProvider View
Coverage
0Review Points
Coverage Gap Map
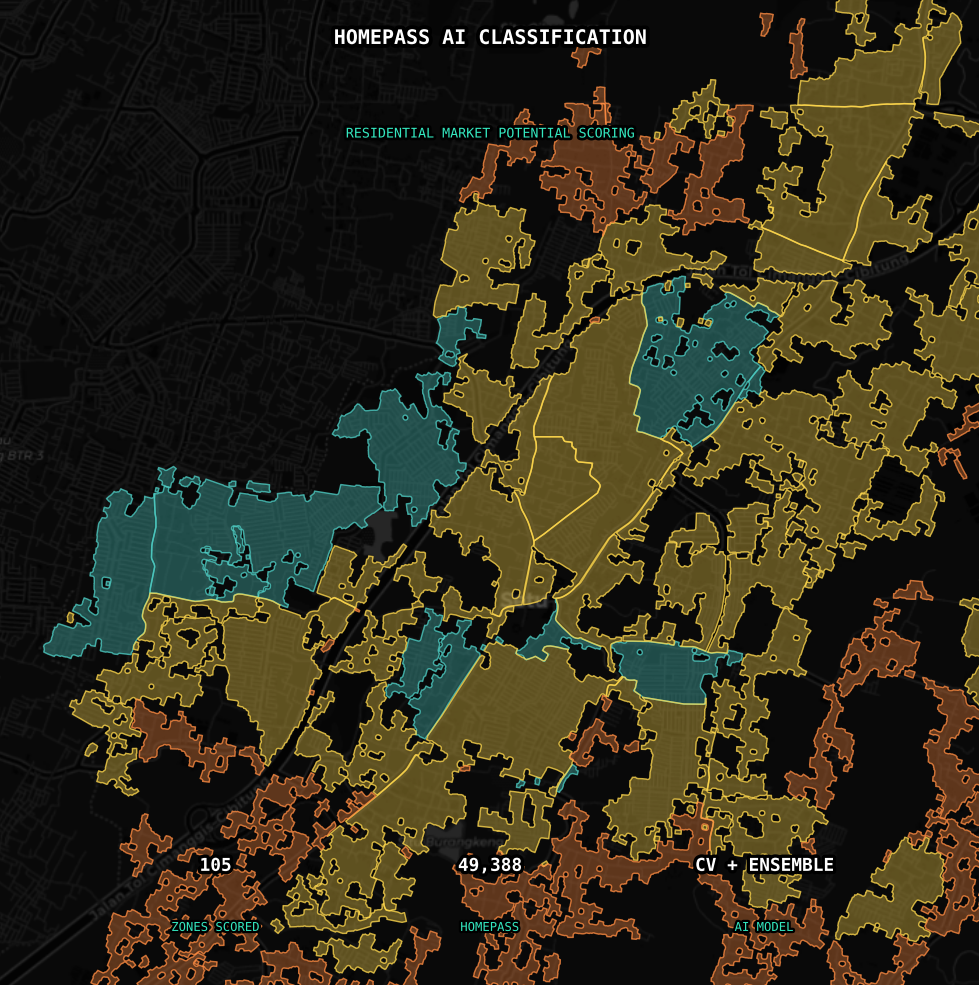
Insight: Closes nationwide data blind zones so assisted homepass classification can reach underserved corridors. Methodology: Measures street level review coverage, buffers reachable evidence, identifies absence zones, and prioritizes field or imagery review against demand grids.
Coverage GapsBufferingAssisted Review
Elevation
0Land use Time Series
Urban Growth Analysis
Insight: Guides five year FTTH rollout sequencing by identifying growth corridors and avoiding overbuild in stagnant areas. Methodology: Compares 38 years of land use time series, region level expansion patterns, and demand context to identify durable growth signals.
Land useTime SeriesGrowth Signal
Mobility
0Daily Snapshots
Mobility Pattern Data
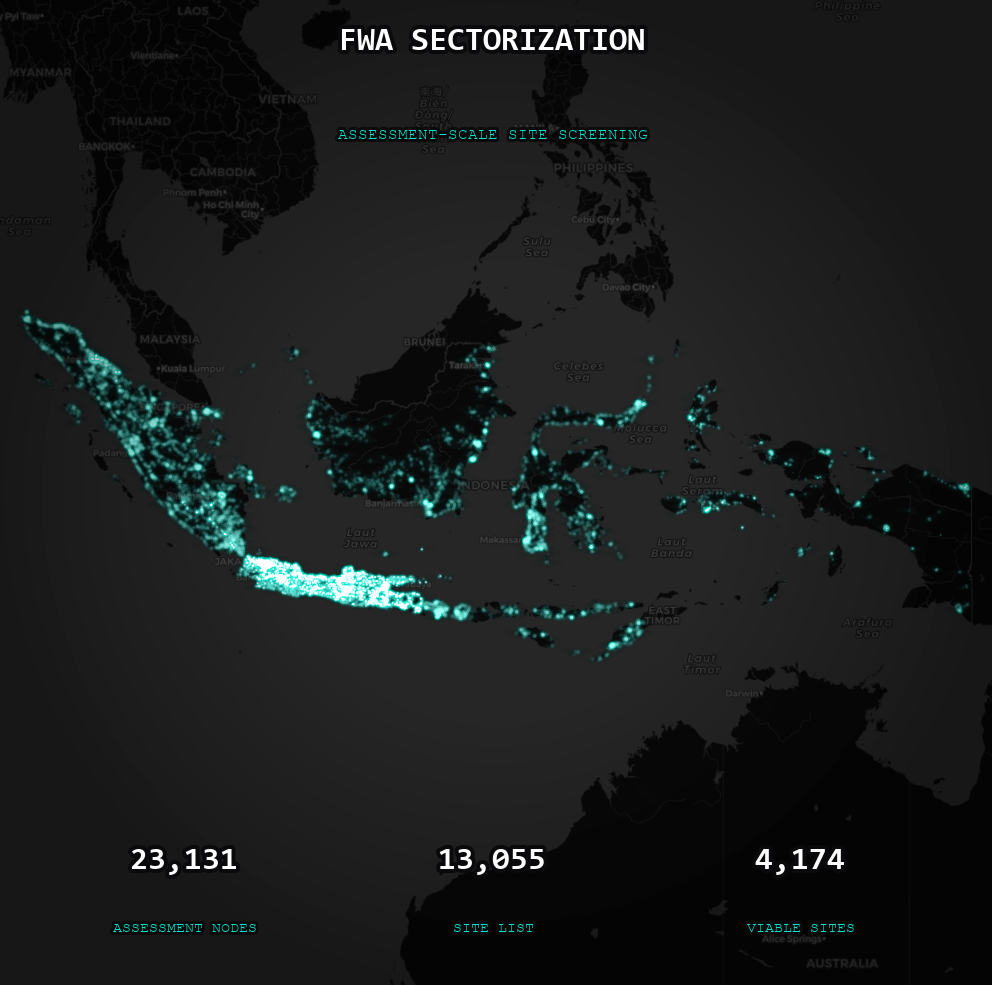
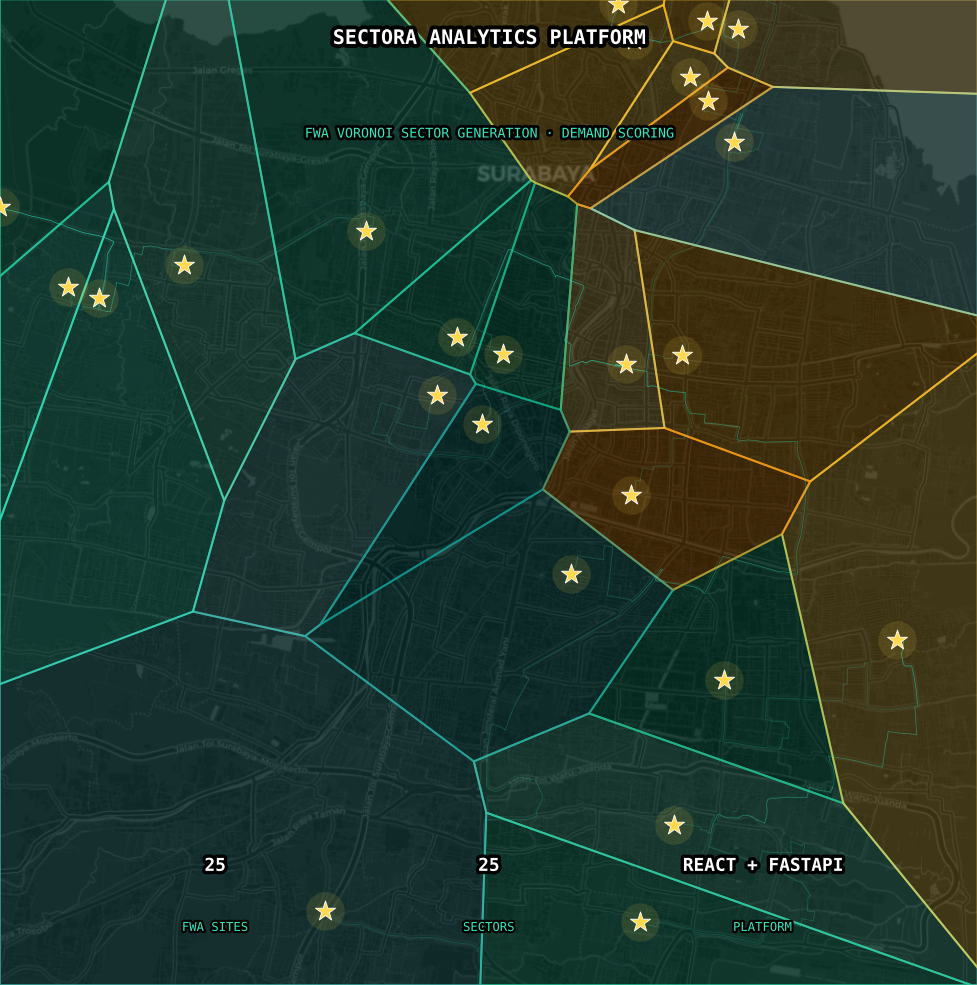
Insight: Reveals where people live, work, and move so demand estimates reflect activity beyond residential address counts. Methodology: Aggregates 365 daily movement snapshots into privacy conscious activity surfaces for FWA placement and commercial corridor revenue forecasting.
Activity SignalCrowd MovementMobility